किपा:2000cardistribution.svg

Size of this PNG preview of this SVG file: ८०० × ३५३ pixels. Other resolutions: ३२० × १४१ pixels | ६४० × २८३ pixels | १,०२४ × ४५२ pixels | १,२८० × ५६५ pixels | २,५६० × १,१३० pixels | ९४० × ४१५ pixels.
Original file (SVG file, nominally ९४० × ४१५ pixels, file size: १.६१ MB)
Summary
| Description |
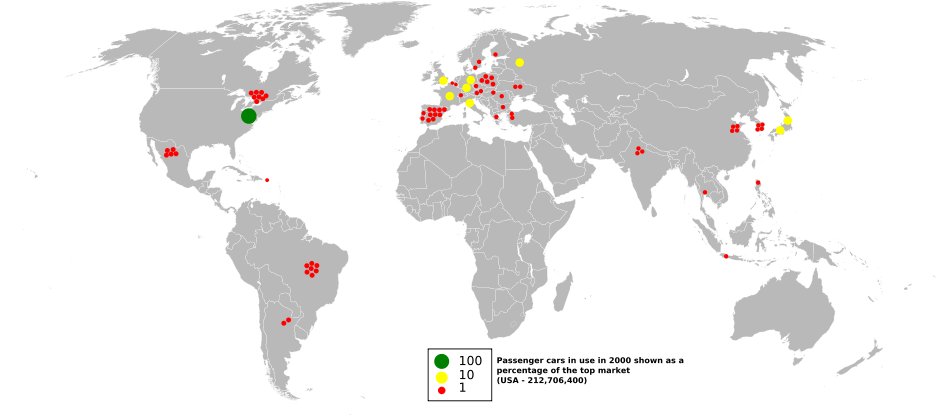
English: This shows the global distribution of passenger cars in use in 2000 as a percentage of the top market (USA - 212,706,400).
Data was extracted on 16th June 2007. Source - http://unstats.un.org/unsd/cdb/cdb_source_xrxx.asp?source_code=6 |
| Date | |
| Source | Own work, information sourced from en:File:2000car.PNG |
| Author | Original: Anwar saadat at English विकिपिडिया – Derivative work: Nevetsjc |
Licensing
| I, the copyright holder of this work, release this work into the public domain. This applies worldwide. In some countries this may not be legally possible; if so: I grant anyone the right to use this work for any purpose, without any conditions, unless such conditions are required by law. |
File history
Click on a date/time to view the file as it appeared at that time.
| Date/Time | Thumbnail | Dimensions | छ्य्लामि | Comment | |
|---|---|---|---|---|---|
| current | ११:३९, २१ जुन २००९ | | ९४० × ४१५ (१.६१ MB) | Esby | text to path applied. |
| ०९:४०, १७ जुन २००९ |  | ९४० × ४१५ (१.५४ MB) | Nevetsjc | {{Information |Description={{en|1=This shows the global distribution of passenger cars in use in 2000 as a percentage of the top market (USA - 212,706,400). Data was extracted on 16th June 2007. Source - http://unstats.un.org/unsd/cdb/cdb_source_xrxx.asp? |
File usage
The following page uses this file:
Global file usage
The following other wikis use this file:
- Usage on en.wikipedia.org
- Usage on fr.wikipedia.org
- Usage on gu.wikipedia.org
- Usage on hi.wikipedia.org
- Usage on si.wikipedia.org
- Usage on ta.wikipedia.org